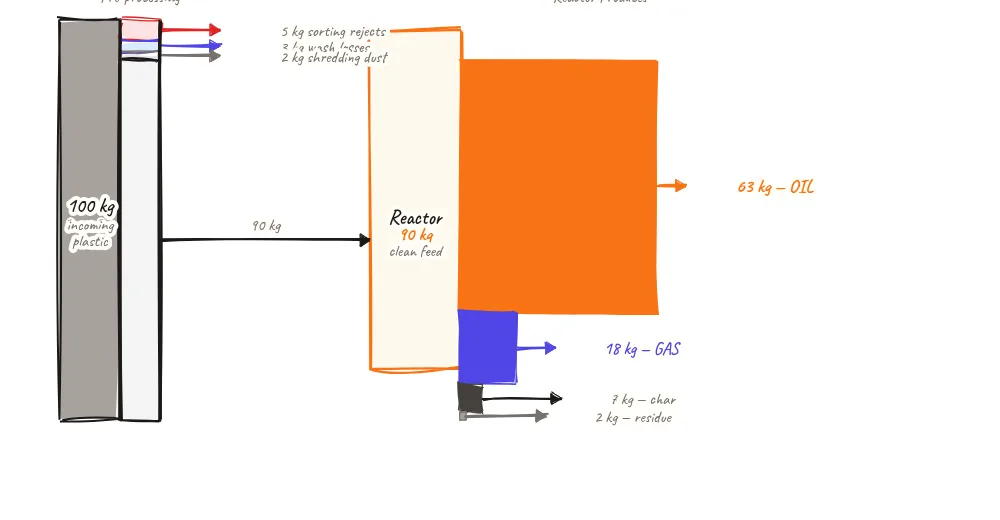
Mass Balance — 100 kg In, What Comes Out
A Sankey mass balance traces every kilogram of incoming plastic through the pre-processing and reactor stages — 100 kg of mixed waste becomes 63 kg of pyrolysis oil, 18 kg of syngas, 7 kg of char, and 2 kg of residue, with 10 kg lost in pre-processing.
Beyond definitions
Planning to start a Plastic Pyrolysis business?
Get the full business understanding — capex, regulations, machinery, vendor questions, and risk checks before you commit capital.
How to read this sketch
This is a Sankey flow diagram where stream width is proportional to mass. Read it left to right:
- 100 kg feed (left, widest stream): All mass starts here — the total incoming plastic.
- Pre-processing losses (downward streams): Three narrow streams split off during pre-processing — sorting rejects, wash sludge, and dust. Total ~10 kg.
- 90 kg into reactor (main stream continues right): The narrowed main flow after pre-processing losses.
- Reactor block: The mass splits into four output streams of different widths.
- Oil stream (widest output, 63 kg): The largest output — proportional width shows it is the dominant product.
- Syngas stream (18 kg): Second largest — recycled as fuel, not a sellable product.
- Char stream (7 kg): Third — sellable but low value per kg.
- Residue (2 kg, smallest stream): Losses and unaccounted.
About this sketch
A mass balance is the accountant's tool for a pyrolysis plant — it tells you where every kilogram of feedstock ends up and validates whether the plant is performing as designed. This Sankey diagram traces a typical 100 kg batch of incoming mixed plastic from the gate to the four output streams.
Of the 100 kg arriving at the plant gate, approximately 10 kg is lost or rejected in pre-processing: about 5 kg removed as sorting rejects (metals, non-plastic contaminants, PVC, PET), 3 kg as washing sludge loss (soil and organic contamination removed in the wash tank), and 2 kg as shredder and granulator dust loss. This leaves 90 kg of clean, dry feedstock entering the reactor.
Inside the reactor at 350–550°C, the 90 kg of plastic cracks into four product fractions: 63 kg as pyrolysis oil (70% of reactor input, 63% of total input), which represents the condensed liquid from the condenser train. 18 kg as syngas (non-condensable gas, 20% of reactor input) — most of this loops back to the furnace as fuel. 7 kg as carbon char (approximately 8% of reactor input). 2 kg as residue — uncondensed lights, moisture-driven losses, and minor unaccounted fractions.
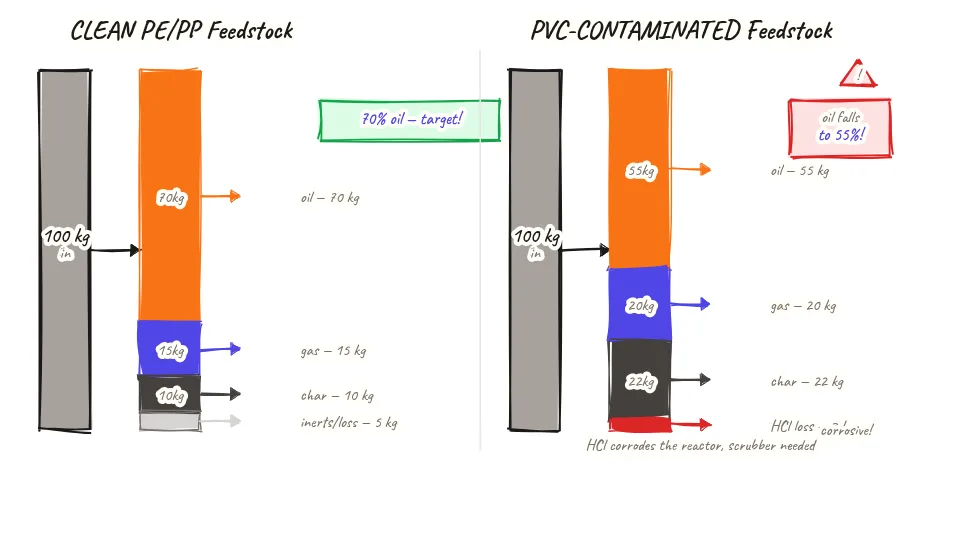
These numbers represent a typical clean mixed PE/PP feedstock. The Sankey changes significantly with feedstock composition: highly contaminated mixed waste might lose 20–25 kg in pre-processing and produce only 50–55 kg of oil. Clean industrial PE scrap might lose only 3–5 kg in pre-processing and yield 72–78 kg of oil per 100 kg input. The mass balance is the diagnostic that shows whether the plant and feedstock are performing together as expected.
Key insights
- For every 100 kg of incoming mixed plastic, approximately 10 kg is lost in pre-processing — improving sorting and washing quality reduces this loss and increases reactor input.
- Oil at 63 kg per 100 kg input (for clean PE/PP feedstock) is the key revenue metric — this number is the commercial target to hit and track.
- Syngas (18 kg) is consumed internally as furnace fuel — it reduces diesel cost but does not appear in the revenue calculation directly.
- Pre-processing loss of 10 kg means the reactor processes 90 kg per 100 kg received — this 10% pre-processing loss is accounted for in feedstock cost calculations.
- Actual mass balance for contaminated municipal waste typically shows 20–25 kg pre-processing loss and 50–55 kg oil yield — 25–30% lower revenue per tonne received.