Product Yield Distribution
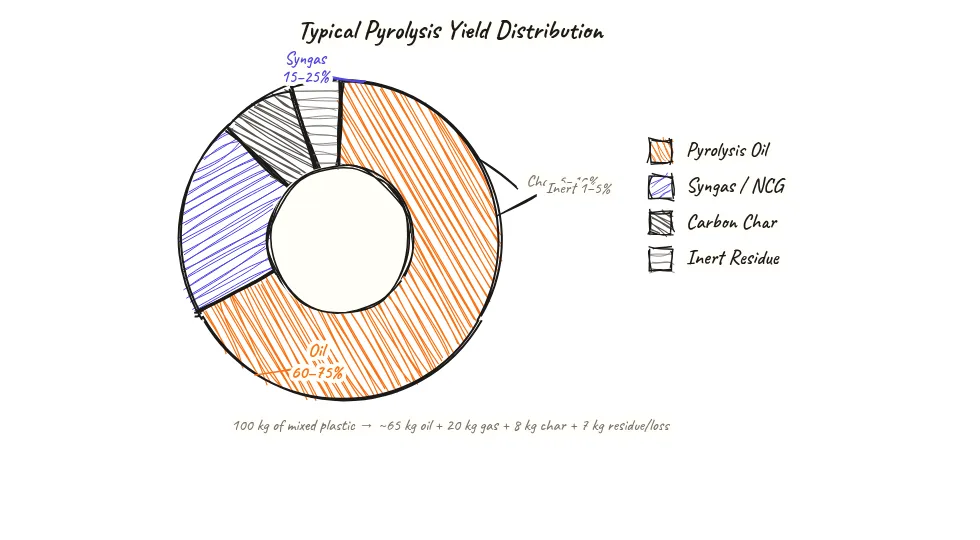
A donut chart showing where the weight goes when plastic is pyrolysed in a typical batch — roughly 60% becomes pyrolysis oil, 20% char, 15% syngas, and 5% processing losses — showing why oil yield is the central metric for plant economics.
Beyond definitions
Planning to start a Plastic Pyrolysis business?
Get the full business understanding — capex, regulations, machinery, vendor questions, and risk checks before you commit capital.
How to read this sketch
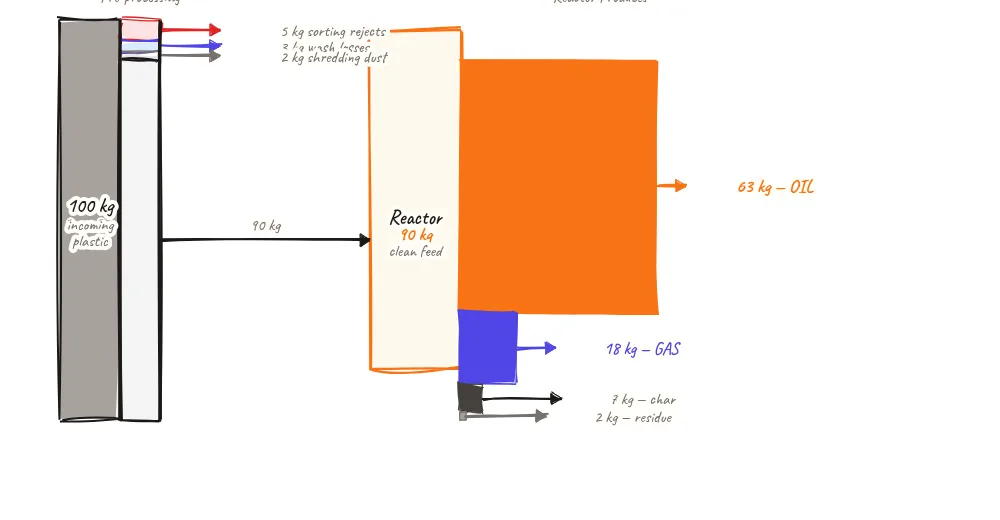
This is a donut (ring) chart. Each coloured segment represents a product or loss as a percentage of total input feedstock weight (basis: 100 kg of plastic in). Read it as follows:
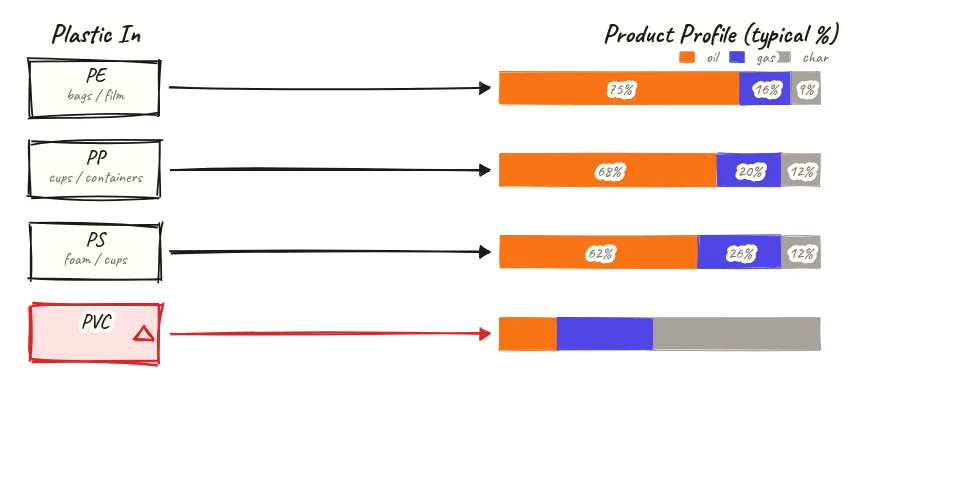
- Largest segment: Pyrolysis oil — liquid condensate. The segment width represents percentage of input weight.
- Second segment: Carbon char — solid residue. Narrower for clean feedstock, wider for high-ash mixed waste.
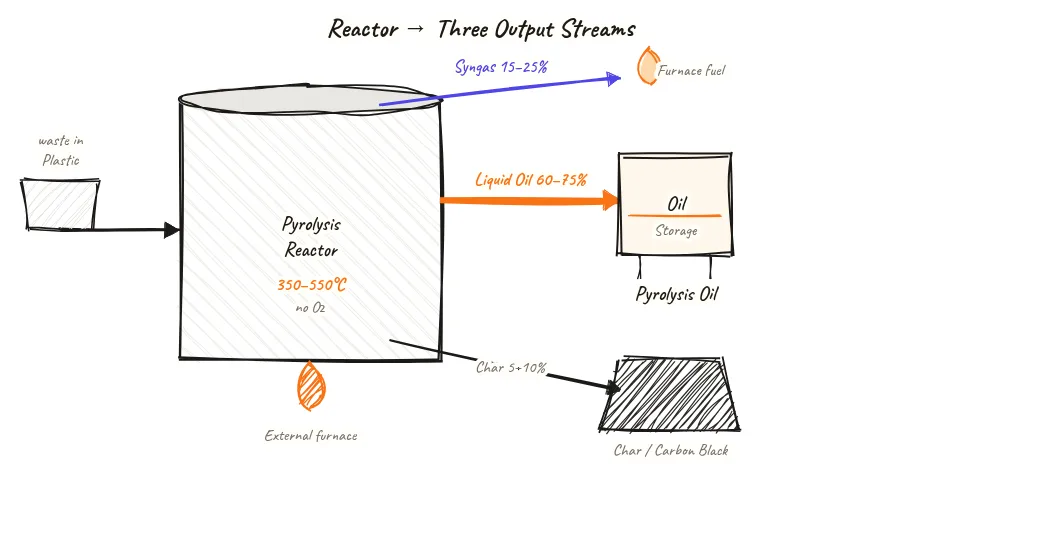
- Third segment: Syngas (NCG) — gas not condensable at ambient temperature. Used as fuel, not sold.
- Smallest segment: Losses — steam, vent losses, minor unaccounted fractions.
- Caption: 'Most value leaves as liquid oil' — the proportion of the oil segment directly drives plant economics.
About this sketch
Oil yield is the single most important operating metric for a plastic pyrolysis plant. It determines revenue per tonne of feedstock processed, and even a 5% difference in oil yield can change a plant from profitable to marginal at current oil prices. This chart shows where the weight goes in a typical batch of clean mixed PE/PP feedstock.
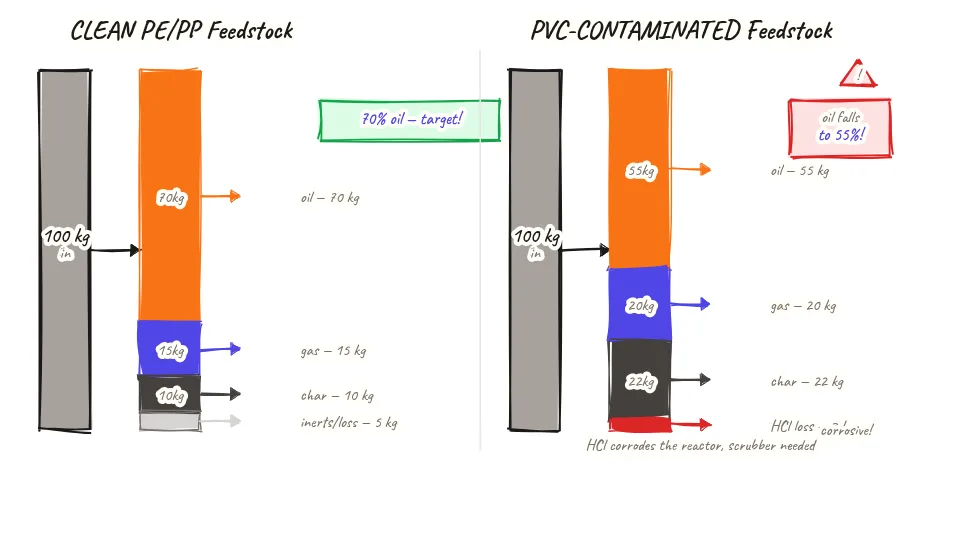
The largest segment — approximately 60% by weight as pyrolysis oil — is the condensed liquid product from the condenser train. This number varies significantly: PE feedstock can give 65–75% oil yield, while a heavily contaminated mixed stream might give only 45–55%. The difference between a good and poor oil yield is almost entirely in feedstock quality — sorting and pre-processing plastic before pyrolysis directly translates to more oil per tonne.
The second segment — approximately 20% as carbon char — is the solid residue. Char yield is inversely related to oil yield: higher-ash, inorganic-contaminated feedstock gives more char and less oil. HDPE and PP with minimal filler content give the lowest char yields (8–15%). Highly filled plastics (e.g., talc-filled PP from automotive parts) can give 25–35% char, much of which is inorganic ash rather than carbon.
The third segment — approximately 15% as syngas — is non-condensable gas. This is consumed as furnace fuel on-site rather than measured as a direct revenue line, but its energy value (15–30 MJ/Nm³) offsets diesel cost substantially. The 5% losses segment represents moisture-related steam, uncondensed light fractions in the gas holder vent, and minor process losses.
Key insights
- Oil yield percentage is the single most important operating metric — it determines revenue per tonne of feedstock processed.
- PE and PP feedstock gives the highest oil yields (65–75%); mixed contaminated streams typically yield 45–55% oil.
- Char yield and oil yield move in opposite directions — high-ash or filler-contaminated feedstock produces more char and less oil.
- Syngas at 15% of feedstock weight is not sold but provides substantial fuel offset — eliminating diesel after startup.
- The 5% loss category — steam and light vent fractions — is reduced by keeping feedstock moisture below 1% before the reactor.